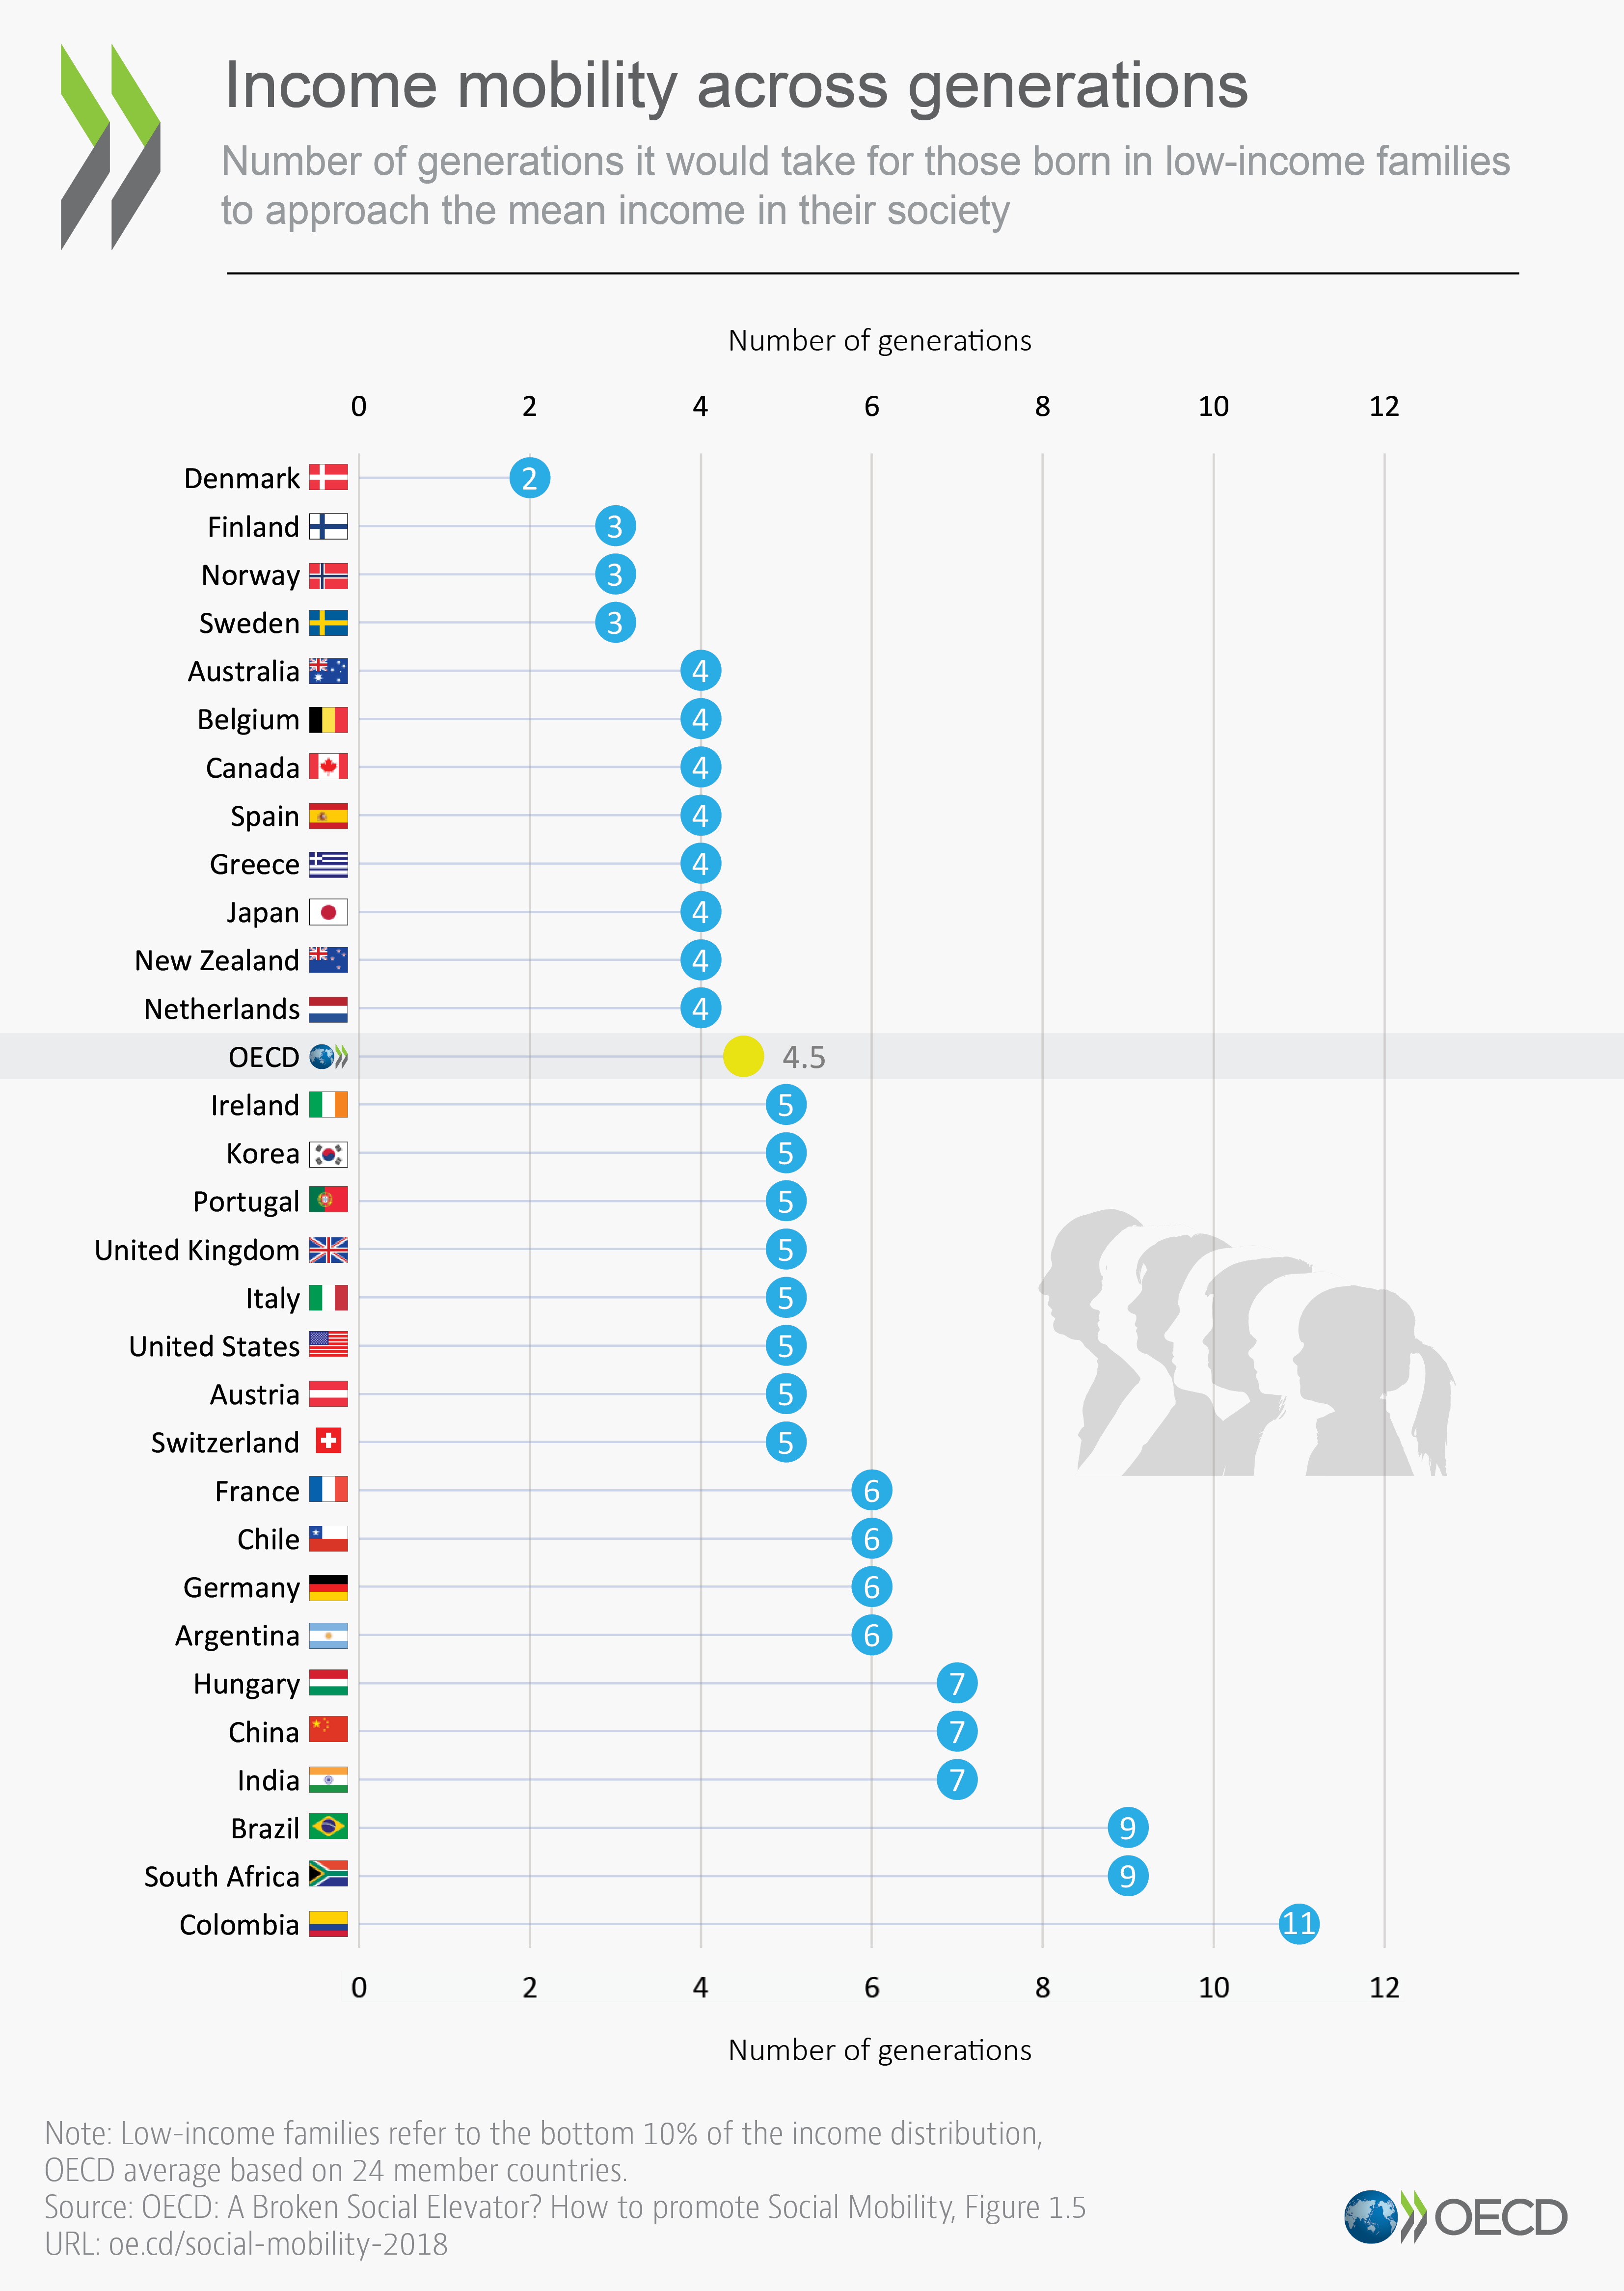
* "It's easier to achieve the American Dream in China, South Africa, and Brazil than it is in the US." South Africa and Brazil are two of the most unequal countries in the world as measured by the Gini Coefficient. I think the author is reading the data backwards.
* "as US billionaires got $637 billion richer since March" - seems like this is cherry picking a market low. If you start the year with 100, it goes down to 60 in March, and is currently 120, I'd say it's more accurate to say your worth has gone up 20%
If you click through the headline for that first claim is "The 12 countries where poor children are more likely to get rich and actually achieve the American Dream than in the US". It's a claim about social mobility, not inequality. I don't think the author is reading the data backwards
I live in Colombia and was in Brazil recently. They're both amazing countries with great people. Go to a comuna or favela and you'll quickly see that it's incredibly difficult for lower income people in these countries to climb into a different social class.
Well, that'd probably explain South Africa - the end of apartheid there has done wonders for the number of black South Africans in better-off jobs, even if it hasn't done all that much good for overall inequality or the economy as a whole, and I suspect this one-off event has messed with however they're measuring social mobility.
> "It's easier to achieve the American Dream in China, South Africa, and Brazil than it is in the US." South Africa and Brazil are two of the most unequal countries in the world as measured by the Gini Coefficient. I think the author is reading the data backwards.
Gini Coefficient and social mobility aren't perfectly correlated. I.e. imagine a society where people's accumulated lifetime wealth is highly unequal but where a 100% inheritance tax effectively resets familial wealth every generation.
They are even opposed, in some sense. The more inequality, the more potential for mobility there is.. at least if you are measuring mobility in absolute terms.
Since much of China's wealthy (idk about Brazil and SA) are newly wealthy, any billionaires are likely to be 1st generation wealthy. Before the 80s, being wealthy was basically banned.
The point is to show that the system is rigged so badly that even during (inevitable) times of crisis, the wealth at the top keeps increasing. The idea being that any group completely insulated from disaster is being insulated unfairly by the suffering of the rest.
The point is that it's not a real increase in wealth. It's like measuring unemployment rates from April to today and concluding that the pandemic created millions of jobs.
I assume some of this is related to all of the manufacturing jobs disappearing. I made $15/hour ($31k/year) working in a lightbulb factory in 1985, at the lowest entry level, with nothing but a high school diploma. That would be $75k inflation adjusted to today's dollars.
If it were just the movement of manufacturing, then the entire country would be poorer. TFA is about the fact that the wealthy people have grown much wealthier, and that requires additional explanation.
Overseas manufacturing is part of it, but the US still makes tons of money, often in industries other than manufacturing. Some of them do have entry-level jobs in the $75k range, but rarely with just a high school education.
Programming is one of those fields, and realistically, we ought to figure out how to do more with the self-taught developers, sans a $200,000 degree. That won't solve all of the problem -- far from it -- but it's indicative.
May be. Or may be not: both Thailand and Brazil have been there for a long time, yet it was China who picked the ball. A coincidence?
Full automation is very far away. But when it happens I'm afraid it will be Chinese workers building factories designed by Chinese engineers from Chinese steel.
This is definitely true. There was an econtalk episode with economist Mark Warshawsky. He had looked at Bureau of Labor statistics and identified that most gains in compensation for low income jobs has been absorbed by rising health care costs: http://www.econtalk.org/mark-warshawsky-on-compensation-heal...
>>Healthcare costs have risen faster than inflation, eating into take-home pay.
Who's fault it is? The government has the power to change all that. You cannot pay your rent with a copy of your health insurance bill. I wonder if people still pay way more out of pockets expenses for healthcare now, despite having super-expensive insurance.
It wouldn't surprise me if an aging and extremely unhealthy population was a contributing factor. We have a 42% prevalence of obesity among adults (1), median age grew in the new millennium (2).
And ironically, smokers die so fast that they cost less money than non smokers to support in the healthcare system, so the decline in tobacco usage has probably contributed to rising insurance costs.
I guess my point is that there are tangible changes to our society that contribute to skyrocketing healthcare costs.
Insurance almost surely contributed to increased costs. Hospitals inflate costs because they want to charge more money to the insurance providers, and they get away with it.
Part of that is also because they need to cover costs of the people who don't pay and also pay for all the special billing people and lawyers required to deal with insurance and people who don't pay.
Does this study account for all of the women that have entered the workforce? Or the greater access to jobs blacks and other minorities have gained in this time. Or the influx of immigrants?
A lot of labor activists complain about “greedy corporations moving jobs to low wage countries.” What does replacing one $50k job here with 10 $5k job in India do to inequality? In a global economy, I don’t think you can have a serious conversation about inequality unless you talk about global inequality. I don’t know what the data there says, but there’s no question that there are far fewer people living in extreme poverty now than 50 years ago. Part of that is driven by some (low skilled) Americans living a slightly less cozy lifestyle.
This is wildly misleading because it’s obviously a terrible time to make any useful historical comparisons. At the end of 2019, unemployment rate among Black people in the US was about 5.5%.
Which makes sense, I suppose, as they are the ones who are responsible for the mechanization/automation that allowed productivity to continue to grow beyond the natural capability of humans alone. They decided to invest in that technology explicitly for the added gains it would bring them personally.
There was once a promise that schooling would provide the path to allow everyone to contribute their own automation to the economy, allowing everyone’s income to continue to increase with the productivity gains they created, but it hasn’t played out in practice. The burger flipper still flips burgers rather than focusing on developing a burger flipping machine.
I get that the "top 1% average" will be pulled up by extreme cases. But I'm surprised at the divergence in the graph between the 99th percentile and even the 95th percentile. Even at the beginning of the period, the difference between the 99p and 95p looks larger than between the 95p and 25p.
A mostly unrelated thought is how stable is the membership in each quantile bucket over time? This is maybe a tone deaf question, bc clearly income inequality is very extreme. But for a tech readership, especially those in startups ... One could earn near the 95p level most years, but when you finally liquidate stock that took you years to acquire, your income can jump up for a year. Similarly, if you're a high earner but you take a year away from work to travel and think, your income drops precipitously. If some fraction of the top k% in any given year were people with infrequent windfalls (selling real estate which appreciated over decades, inheritance, maybe legal settlements?), and some fraction of the lower quantiles is people who are temporarily not working ... then the income distribution is a combination of long term inequality between people, and variability across people's lifetime, which might be hard to disentangle.
Economic mobility in the US is the lowest or 2nd lowest among all OECD nations. I think this means that what anecdotal stories one can tell or find about economic mobility ("Look! Kid from poor impoverished rural town made big bugs as a software developer!" or whatever), the more important reality is that Americans do not move between quartiles or quintiles as much as people in other OECD countries, let alone as much as they like to imagine happens.
[ Edit: as of 2020, the US is roughly middle of the pack for economic mobility among OECD nations, and was not lowest or 2nd lowest, but 4th lowest in 2012 ]
I would caution that "economic mobility" is a term of art that does not mean what most people intuit it to mean, usually conflating it with the ease of improving absolute financial position. You can easily improve your absolute financial position and still have "low mobility", and you can have "high mobility" while having minimal opportunity to improve your financial position. A limitation of economic mobility is that it is only comparable between countries with similar geographic/population size and with similar levels of wage compression. The US is an outlier in all three terms.
Average people want the opportunity to significantly improve their financial position, and economic mobility doesn't measure that. As a country, the US outperforms most other industrialized countries at the former.
Economic mobility doesn't measure relative financial position either. Economic mobility only indicates position relative to a (highly variable) income distribution within a country. A "high" income mobility does not imply high relative changes in financial position, nor vice versa.
At the extreme, very small differences in relative income can make you "highly mobile" even though you've barely moved your relative financial position. This is seen in smaller industrialized countries with very compressed wage distributions. People in low mobility countries can have better financial outcomes in both relative and absolute terms depending on the mathematical distribution function, and do in practice.
The term "economic mobility" is widely used to push misleading narratives precisely because most people don't understand what it measures.
It really gets strange at the top. Think of an engineer who has been working at a FAANG company for the last 10 years. They have a salary of $200,000. They're vested and get stock bonuses every year. They now have $1,000,000 worth of stock and they sell $500,000 to put a downpayment on a home in California. They're income for the year is now $700,000 putting them just about in the top 1% of income earners for the year[0].
But they're in there with Warren Buffett and Jeff Bezos, et al. Jeff Bezos is worth something like $140B or more, whereas the engineer is worth ~1.4M. (Probably less because they only own a portion of their house, but it makes the math easy.) Mr. Bezos is worth 10,000x what the engineer is worth.
But a middle income person nearing retirement in the Midwest might outright own their house, which is worth $140,000. If they sell that house, that midwesterner is just in the top 10% of income earners (assuming their salary is modest). The engineer only has a yearly income 5x more than that person and their net worth is only 10x the midwesterner's. It's a really big difference in that last percentile!
This is good argument for increasing minimum wage. The federal minimum wage is still only $7.25. Inflation adjusted, it has been decreasing since 1968 [1]. Once you factor in rising healthcare spending, which has gone up by 5.5x in the same timeframe (inflation adjusted) [2], the problem is further compounded.
Given the high GDP growth in the same time frame, it feels like a big miss by the federal government.
A somewhat off topic question, but every time liberte, egalite, fraternite is discussed I want to ask a question: what do we do with stupid and lazy people?
And then for extra credit: what do we do with the children if stupid and lazy people?
How will inequality evolve as technology continues to rapidly progress through automation?
COVID resulted in large unemployment... yet we still function optimally when it comes to manufacturing/supplying/delivering life's basic necessitates, as well as generally performing work function on a large digital infrastructure primarily capitalizing on its continued evolution. To me this is an alarm that makes apparent our market economy is not aligned with technology's true state and our society is very vulnerable to rapid risk we can't rapidly mitigate or adjust to. Also showing that other countries like China are in an operating model (whether humane or not) that is better aligned.
"AI" basically pitches an optimum point called the "singularity" and something I understand simply to be a technology that can make improvements to itself without us helping it. -- implying automation for all aspects of life.
So what happens along the way? ... because we're approaching any singularity very iteratively and where 1 person can own some automation that replaces a million jobs.
Inequality seems like it's only going to get worse. Hoping someone can reference any research in this area or how our market economy can evolve (admit my thought process here is very naive and anecdotal)
Military leadership also expresses views that go against conservative orthodoxy.
- they believe climate change is a real threat.
- they are constantly trying to get rid of weapons and military bases they don’t need to save money. But the civilian leadership won’t allow them because of loss jobs.
- they are constantly warning that the deficits caused in part by military spending put the US at risk. While this may seem counterintuitive, but most wasteful military spending isn’t done for the benefit of the military or the enlisted. It’s done to support the private military industrial complex.
The Iraq War was also a big example. Military leadership wanted 3-4x the troops and to immediately start working with the existing Iraqi military and government in order to secure the country and get it back on its feet. Instead, the civilian leadership only sent in enough troops for a military victory and disbanded the Iraqi military and government because they believed America knows best and didn't need help from the locals.
I’ve never been in the military. But looking from the outside and having interacted with a lot of military veterans, it seems like all of the issues with the current US military is because of the corrupt, idealogical civilian leadership. This isn’t meant to be partisan. I think Bush I executed the first Iraq war well.
Many (most?) of us business-founders/owners do worry about inequalities, please don't label us all as a heartless one-track automatons. There are many entrepreneurs/CEOs who would like universal healthcare, justice system reform, and some form of UBI.
Not enough information. It greatly depends on what money is required to live a reasonable life.
In one of these scenarios, is child poverty eliminated? People going bankrupt because of medical bills? Are there predatory lending practices and pervasive rent seeking monopolies?
In general people concerned with inequality are worried about people at the low end of the income spectrum not being able to survive and thrive, not abstract dollar amounts which don't equate into purchasing power for someone's next meal or monthly dose of prescriptions. Figure out how to expand the social safety net on the low end, and people will care far less about people on the high end making fairly obscene amounts of money, as long as they don't abuse that into extending their power and privilege.
then why is virtually all of the rhetoric focused on the 1% and jeff bezos and taxing the rich? i don’t hear any concern for the poor, only hatred of the rich
I myself prefer option two, but if you were to change the supposition to: assume you have a chance to be born into a society at random but you don’t know who you will be, which would you pick?
Then option 1 looks a little appealing as a way to reduce risk (though I get that option 2 has a better expected value).
A substantial part of that can be explained by the decrease in labor force participation. A lower number of wage earning workers must support more non-earners, so various redistribution mechanisms do that.
The headline is a non-sequitur of the finding, which says that if GDP growth was equal to salary growth, the median salary would be $102,000.
That has nothing to do with income inequality. GDP itself is a problematic figure, but its relation to income is rather loose.
If everybody earned the mean income, that would be perfect income equality. For the US, mean household income is around $72,000, whereas median household income is around $62,000.
It appears to be about prime age, full time workers. This could result in a higher number than mean household income because it excludes retired households, those with significant non work income, unemployed households, etc.
In your calculation using that table you are leaving out the income of the top 1%. The 99%ile represents the income of the top of "the 99%". In table 2.b, in the main article, you get a taste of the size of the 1% income, which is on average twice the 99%ile.
In the paper I didn't find figures that I could use to reconstruct how much money would have to end up in someone else's hands to achieve the counterfactual, just that it's obvious that the 1% average going from $1,384,000 to $630,000 would represent a lot on its own. The other groups above the median would also have received less of a share. Also note that it may have happened that between 2007 and 2018 the 90-98%iles may have already received some of the money that used to accrue to the 99%ile, who knows why.
I think BI properly quoted the article, but there would be a lot of work to do to contextualize the whole thing. If growth were more shared, would there be more or less growth? That depends on whether the top 1% are actually creating GDP or whether they are just better at capturing the income from it. If there was a system in place that had paid the bottom 98% more, would there have been more inflation, eating away at real GDP growth? What does that big swing from 2007 to 2018 really mean for the 99%ile in C1b, not reflected in C1a?
Honestly, this paper raises more questions to me than it answers.
> In your calculation using that table you are leaving out the income of the top 1%. The 99%ile represents the income of the top of "the 99%". In table 2.b, in the main article, you get a taste of the size of the 1% income, which is on average twice the 99%ile.
I am not leaving anything out, I am using the same table that the BI article used, the one with the $102,000 counterfactual representing "Full-Year, Full-Time, Prime-Aged Workers". The one you mentioned yourself.
If I were to instead use Table 2b, the median counterfactual would only be $57,000 and I would be making the same argument with different numbers.
> In the paper I didn't find figures that I could use to reconstruct how much money would have to end up in someone else's hands to achieve the counterfactual.
All the figures are there. Just take the delta for every percentile and add it all up. If the sum is negative, you can't achieve the counterfactual by income redistribution. (Spoiler: The sum is negative)
Why the huge disparity? It's because the GDP and income are only loosely related. The US has collectively been spending more than it earned for decades, and all that spending goes into the GDP.
> I think BI properly quoted the article, but there would be a lot of work to do to contextualize the whole thing.
They may have "properly quoted" the article, but they came to a wrong conclusion that feeds into the popular "the rich are taking all our money" narrative.
The 99th percentile leaves out the income of the top 1 percent. And, in any event, none of these graphs are really representing the size of each slice of the pie for a group of people, they're just looking at the income at that level.
I guess we'll have to agree to disagree. I don't find the paper very informative, but I find the BI article to be an accurate representation of what the author is trying to say.
> The 99th percentile leaves out the income of the top 1 percent.
Again, you could use table 2a, which specifies the top 1%. You would have to come to the same conclusion, if you do the math.
Of course the top 1% did disproportionately grow their income relative to GDP growth, it's just not enough to redistribute to make everyone else fall in line with GDP growth. Not even close.
> And, in any event, none of these graphs are really representing the size of each slice of the pie for a group of people, they're just looking at the income at that level.
The tables give you all the information you need to infer the slice of the pie. Just add up all the incomes for every percentile and you have the size of the pie, add up the incomes for a percentile group and you have the size of the slice.
For table 2a, the size of the pie is $8,529,000. The bottom 25% earn $375,000, or less than 5% of that. The top 1% on the other hand earn 13% of it. I'm not questioning the existence of income inequality. That's not the point.
The point is that this income inequality is not the reason for why GDP growth is so detached from income growth. Incomes didn't grow in tandem with GDP for almost every income group. For those income groups that did surpass GDP growth, it didn't surpass by the amount necessary to make up for lack of growth for everyone else. Yet, this is the conclusion that the BI insider wants to draw. The paper doesn't draw this conclusion, probably because it is obviously wrong.
> I don't find the paper very informative, but I find the BI article to be an accurate representation of what the author is trying to say.
It has a lot to do with income inequality. GDP is a reflection of overall economic activity. If it grows by 10%, it's entirely reasonable to expect that most people's income grow by some number that has a linear relationship to 10%. That's largely what happened in the 50's and 60's.
The conventional measure for this is "percentage of GDP distributed as wages". This number has mostly dropped for the last 35-40 years, whereas its corollary - "percentage of GDP not distributed as wages" has grown. This is the largest single contributor to current income and wealth inequality.
Wages grow as demand for labor grows and increased economic activity should increase demand for labor. So far so good.
However, that's about as far as the relation goes. Technological improvement can both reduce the demand for labor and increase GDP. If there is no reason for demand for labor to increase, wages won't rise.
The narrative that a small percentage of people is earning so much and therefore everyone else must earn far less is popular, but mostly wrong. I gave you the source that says perfect income redistribution would cause only a wage increase of less than 20% to the current median. That's the real impact of income inequality, it's not more than 100% like this article would like you to believe.
>Technological improvement can both reduce the demand for labor and increase GDP. If there is no reason for demand for labor to increase, wages won't rise.
That's a political statement, not a law of nature. Bundled up in there are a large number of assumptions about how an economy works, how taxation works, what the purpose of a society (or even just technological advancement) really is.
I appreciate that for a lot (most?) people in the USA today, your beliefs about this are the common ones, and they seem self-evident and obviously true. But they are just one choice among many.
If you can't appreciate the difference that every single full time worker making $72k/year would make over the current situation (median of $62k/yr, up dramatically from just a couple of years ago when it was $53k), then I don't think I can help you. Moving the mean of a distribution to "less than 20% higher" than the median is huge!
> That's a political statement, not a law of nature.
That's the way it works in our system, which finds wages through supply and demand, which is a law of nature. You may nitpick and find a couple of salaries or other types of income that are not priced in this way, but it is generally true for the average person.
Whether that system is the best system is indeed a political question, but that's besides the point.
> Moving the mean of a distribution to "less than 20% higher" than the median is huge!
Perhaps, but it's nowhere near the 100% change that the article promises.
>That's the way it works in our system, which finds wages through supply and demand, which is a law of nature.
Is this 8th grade economics? Consider a nation that has strong tariffs on imported goods. Consider another nation that has major obstacles to the investment of foreign capital, and lots of cheap labor. Now consider a political campaign (it doesn't look a campaign, but it is) to remove the tariffs and allow capital to move freely from the first nation to the second.
Result: dramatic changes in the first nation's wages, at least for work that gets moved to the second country.
Remind me again which law(s) of nature is involved here.
I don't think it even makes sense to calculate US wages as a percentage of US GDP, because if I'm understanding the definition of GDP correctly it includes economic activity done in non-US countries with non-US workers. In particular, it's defined as the total value of finished goods produced in the country, which I think means that it includes the cost of imported components and raw materials even though that money doesn't end up in the US at all. So if production of those raw materials and components moves from the US to other countries - which it probably has done, quite a lot - it wouldn't affect GDP but would affect the actual pool of money that US workers could get paid from.
Actual labour share of the actual money being made seems to be pretty hard to measure accurately, from what I can tell.
What you've described is a nice summary of strategy #1 in the pantheon of strategies used by capital to reduce the percentage of GDP that goes to wages.
You weren't actually claiming that the overseas labor got the same chunk in wages that used to go to US labor, were you?
* "It's easier to achieve the American Dream in China, South Africa, and Brazil than it is in the US." South Africa and Brazil are two of the most unequal countries in the world as measured by the Gini Coefficient. I think the author is reading the data backwards.
* "as US billionaires got $637 billion richer since March" - seems like this is cherry picking a market low. If you start the year with 100, it goes down to 60 in March, and is currently 120, I'd say it's more accurate to say your worth has gone up 20%
I agree with Shiller that growing inequality is a big problem facing the US: https://www.youtube.com/watch?v=NwhUN42BGE8&ab_channel=sssir.... This article is a low quality analysis in my opinion.