Seems to me like breaking the gold standard has lead to quite a bit of inflation.
One problem with our view of inflation is that it's compounding...
Now, I think the real reason we have compounding and printing of money is that it's a form of taxation (on currency holders) and it makes government debt cheaper and cheaper each year that passes.
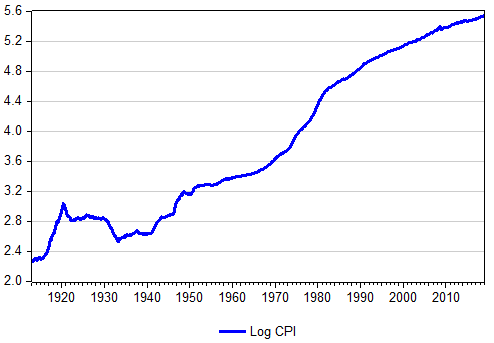
That graph is misleading because you're plotting cumulative inflation on a linear graph rather than a logarithmic graph. The basic issue is that you should expect every 20 pixels to have the same weight, but you feel the impact of inflation as later/earlier rather than later-earlier.
For example, compare 1940 to 1950 with 1990 to 2000. Cumulative inflation rises 110% for 1940-1950 and 450% for 1990 to 2000. But, $1 in 1940 will be worth 57¢ in 1950 (145%/255%), and $1 in 1990 will be worth 77¢ in 2000 (1365%/1775%).
There are two ways to fix this: you could plot yearly inflation, but it's difficult to see long-term trends; or you can plot cumulative inflation on a logarithmic scale, but people aren't as used to logarithmic scales.
understood, but the issue with assuming logarithmic expansion is "normal / desirable" is that it hides the fact that exponential inflation is the same as negative compounding returns on cash. With compounding inflation eventually it will take all of the money currently(today) in circulation just to buy a single loaf of bread.
Seems to me like breaking the gold standard has lead to quite a bit of inflation.
One problem with our view of inflation is that it's compounding...
Now, I think the real reason we have compounding and printing of money is that it's a form of taxation (on currency holders) and it makes government debt cheaper and cheaper each year that passes.