quote: tax payments and the share of the tax burden borne by the top 1 percent climbed sharply
This is the reason for that phrase lies, damned lies and statistics. The top 1 percent have been getting an ever-increasing share of gross national income, so their share of gross national taxed income, hence gross tax take, correspondingly went up. Meanwhile, we're staring at a total meltdown on the demand side of the equation -- people who aren't in that top tier have seen their real wages fall consistently since the 1980s. What happens to a consumer economy when you've starved all the consumers?
I'm not saying that the tax code created that upward aggregation - technology, globalization and outsourcing labor are probably the biggest factors in that order. But it seems like a solution addressing the exact opposite of the problem.
...people who aren't in that top tier have seen their real wages fall consistently since the 1980s.
This claim doesn't pass the smell test. Can you name a single good or service (note: not a category of goods/services) which is less available today than it was in the 80's? If not, then real wages (i.e., wages measured in terms of the amount of stuff they can buy) have not gone down.
I overspoke. They've stagnated for the bottom 4 quintiles since the early 80s, and declined since 2000. For future trends, I'd extrapolate from the current U-3 and more importantly U-6 figures (they don't look good).
In general, the definition of economic concepts does not include references to specific government agencies. Are "real wages" not a meaningful concept in Mexico, beyond the reach of the BLS?
If you look at the definition of inflation (keep track of units!), you can immediately see that wages indexed by inflation == amount of stuff you can buy.
As for BLS inflation numbers, I agree that by that specific measurement, real wages appear to have stagnated. On the other hand, people today have more stuff than they did in the 80's. That suggests the BLS inflation numbers might not mean what you think they mean.
(It's actually pretty clear why they don't quite match up if you look closely at the methodology of the BLS. The basket of goods used to compute inflation today is larger than the basket of goods in 1980. A proper measure of inflation would take a fixed basket of goods at t[0] and measure the cost of the same basket of goods at t[1]. But that would require different inflation measures based on the starting year. This would be too complicated to give to politicians, so the BLS doesn't bother. )
Ok, so let's throw out the BLS inflation numbers even though they're the standard for basically everyone in academia and industry because you don't like what they say in this case? What's the alternative? I wasn't talking about Mexico, I'd defer to the canonical inflation figure for there if I were.
If you want to kibbitz about the basket of goods, fine.. but that conversation's gonna go right to "fix our egregiously broken healthcare system".
The BLS numbers are not as good as you seem to think, and many people are aware of their flaws. For example, the Boskin Commission (in 1996) concluded that inflation was overstated by about 1.3%/year (up to 1996, which includes about 16 years of the period you are interested in).
Regardless of your argumentum ad populum, do you disagree with my claim that a correct measure of inflation should not use an expanding basket of goods? If so, please explain why we should care about this quantity:
BLS-adjusted wage = (nominal wage) x (cost of smaller basket A in 1980) / (cost of bigger basket B in 2010)
So did you cancel your subscription to the Economist and the WSJ? Because they cite the BLS inflation numbers all the time, like multiple times per week.
BLS inflation numbers get cited all the time. That doesn't mean they actually show what [random pundit X] thinks they show. In particular, they don't support the claim that people have less purchasing power now than they did 30 years ago. They don't directly measure purchasing power; "real wages" is a misnomer, and a decrease in "real wages" doesn't necessarily correspond to "starving" the consumers as you claimed in an ancestor post.
When asked to directly measure purchasing power, why do you instead go for the "appeal to authority" regarding an indirect and clearly flawed method? Why not try to actually directly answer the question at hand: name one good or service that is less available now than it was 20-30 years ago, thereby establishing an actual decrease in purchasing power for the consumers you claim are being "starved".
Look, if it's the BLS with their 70 year history vs yummyfajita's basket of goods he'll throw together to try and prove the point, I'll stick with the BLS. Nothing against Mr. fajitas, he's a smart guy. But I could throw together an index that was heavy on healthcare and gasoline costs, maybe factor in average debt level and show the opposite.
I didn't throw together a basket of goods, because I think it's true for virtually any constant basket of goods. Feel free to construct your index which is heavy on healthcare and gasoline - I think you'll fail.
Gasoline won't help you much, wages have kept up with gas prices [1]. I don't see much reason to believe a basket of 1980's health care goods would help you either. All the drugs would be out of patent (and vastly cheaper), among other things. Feel free to prove me wrong.
The particular basket you pick just doesn't matter, because I don't think there is a single good we can afford less of today than we could in 1980. We drive more cars, live in bigger houses, we wat more food, consume more medicine, and we have more appliances. Feel free to cherrypick a basket and prove me wrong.
Look, CPI is a fine measure for what it is aimed at. But it is not designed to calculate real wages in the manner you seem to want it to. No inflation measure with a variable basket of goods could possibly do that.
If you think I'm wrong, please post a basket of goods which has inflated. Or feel free to go back to appealing to authorities who are misusing measures created by other authorities for a different purpose.
[2] People do consume less of some things, e.g. land line telephone service and television. But that's only because they have become rich enough to afford more attractive alternatives, e.g. cell phones and video games.
The question at hand is "how do we measure whether consumers have less purchasing power than before?"
It doesn't matter how long the BLS or yummyfajitas have been taking measurements. The only thing that matters is whether the measurement is accurately capturing what we want it to capture, and whether it shows that real ability to purchase stuff has gone up or down. The BLS measurement doesn't accurately measure purchasing power; it's misleading to act as though it does. A measure that takes the same items in 1980 and 2010 and compares wages to total price would be far better, and I contend that you would have to work very hard to create such a measure that shows what you claim.
My challenge to you: come up with the measure based on your actual spending habits. Compare your wage to that of someone in a comparable socioeconomic position 30 years ago, and calculate how much it would've cost to maintain an equivalent lifestyle 30 years ago. Unless you have very, very unusual spending habits, you'll find that your purchasing power is much higher now than someone in the same relative position in the 1980s.
So does housing(0)=a cave? We've been improving ever since.
I understand your point that for a buck we get more today than previously, but really what is happening is that the wages for the bulk of people are stagnant or shrinking relative to the measure of inflation (which over 20 years really hasn't changed that dramatically, especially when it ignores gas prices which have gone up 300% in nominal dollars in 15 years) while the tippy top are seeing their wages grow relative to that same measure of inflation.
You are argueing the point on "real wages", which I see you point, but really the problem is that "real wages" are increasing very quickly for a tiny fraction of people, and not for everyone else. How you actually define real wages doesn't matter so long as it is the same for both groups you are comparing.
Yes. The fact that a suburban house with electricity, running water, heating and assorted other amenities costs more than a cave with a firepit is not inflation.
Similarly, it's also not inflation for cheese fries to cost more than french fries.
How you actually define real wages doesn't matter so long as it is the same for both groups you are comparing.
This is true only if you want to make a relative comparison. I wasn't making a comparison at all, I was simply pointing out that everyone in the US, in every decile, has a lot more today than they did in 1980.
really the problem is that "real wages" are increasing very quickly for a tiny fraction of people, and not for everyone else
Mr. Fajitas's distinction is important. Without it, the picture being drawn is one of a declining middle class; a trend that, if continued, will see us all digging in the dirt just to live. But this is woefully incorrect. We're all better off. The middle class has much more goods and leisure time. Even the poor have more.
Really, I have trouble seeing the problem here. As far as I can tell, the real objection is simply that the rich are getting richer at a faster rate than everyone else. And that seems like nothing but simple envy.
It implies that there is a disparity in effort vs. reward, which to many seems unfair (not to mention the truly rich have no need nor use for all their money).
It is not that rich people do not deserve riches (well, some don't). It is that the rest of the people do not deserve any less.
I think the point that jbooth is trying to make is that, the wealth of the country has measurably increased since the 1980's but that increase is going mostly to the wealthy. The problem is jbooth is trying to prove this using inflation data. Indexing purchasing power to a constant basket of goods is missing the point because our production has become more efficient over that time.
But this is exactly the point he's trying to make: While productivity has increased across the board, the wealthy are gaining disproportionately from that increase in productivity. I think this is indisputable. The middle class is shrinking precisely because what it means to be "middle class" should reasonably grow with increases in productivity. However, this isn't happening. And by many measures its decreasing (say health care, college education).
The question should be then: is it in societies interest to make sure that the benefits of increased productivity are distributed more proportionally, and should government attempt to accomplish this.
The middle class is shrinking precisely because what it means to be "middle class" should reasonably grow with increases in productivity.
And it has. Every decile has considerably more stuff today than they did in 1980. More cars, bigger houses, more food, more medicine, and more education [1].
Jbooth is making the fallacy of measuring income in non-constant baskets of goods. His claim is that in 1980, median wages bought you 1 basket of goods, and in 2010, median wages still buys only 1 basket of goods. He is deliberately ignoring the fact that the basket in 2010 is bigger.
However, this isn't happening. And by many measures its decreasing (say health care, college education).
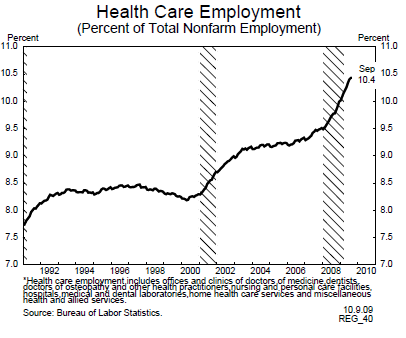
The same is true of medicine - we consume more drugs, visit the doctor more, and get more treatments. According to a quick google search, the % of the labor force producing health care has gone up considerably: http://www.doctorhousingbubble.com/wp-content/uploads/2009/1...
You might want to argue that consumption should have increased more, but it's nonsensical to argue that consumption has not increased significantly (as jbooth is).
[1] I don't like treating education as a consumption good, since it's primarily purpose is to gain credentials/skills so you can get a job.
But its not too far from being true, wages have increased very slowly vs. GDP. What _has_ risen at the same rate as the GDP is the amount spent on employee compensation, but that includes wages, benefits, and the costs of administering the first two. A lot of this is rising health-care costs that have been increasingly been met by employer provided health insurance, but part of it is just companies preferring to give compensation in ways that won't be taxed.
"The top 1 percent have been getting an ever-increasing share of gross national income, so their share of gross national taxed income...people who aren't in that top tier have seen their real wages fall consistently since the 1980s."
Actually, I find this side of the argument to fall under the heading of "lies, damn lies, and statistics." The problem with this argument is that it conflates "population segment" with "particular individuals." You see that the top one percent get a larger share and conclude that the rich keep getting richer while everyone else gets poorer. If those population segments were static, this would be true. In reality, these groups are very dynamic and people move between them throughout their lives, so when you look at "the bottom twenty percent" over a multi-decade period, you're not looking at a fifth of the population permanently trapped at the bottom of the totem pole, you're looking at many different people starting out in that position before moving up. Certainly some of them are stuck there, but most of them aren't. The top 1% is extremely volatile: I don't have any statistics handy but I have read more than once that the percentage of the top 1% who were up there ten years prior has fallen dramatically since the '70s. It's not the same people getting richer, it's new people (who used to be well below that top tier) getting even richer than the last set of top earners.
As an example, consider a typical middle-class American family: they start out as two individuals fresh out of college each earning thirty or forty thousand dollars a year: nowhere near the top 1%. As they gain experience they begin to earn more and more each year, moving up into higher earning segments. At some point they meet each other and get married, dramatically increasing their "household" income (and creating difficulties for economists trying to make apples-to-apples comparisons). In their fifties they hit their peak earning years and spend half a decade or so in the highest tax bracket: not in the top 1% of earners, but probably in the top 10% or some other arbitrary slice frequently villified as earning more than their "fare share" of income. Then their income tapers off as they transition into retirement and they fall back into the next quintile down, maybe even two quintiles down. For their entire working lives prior to retirement they saw their income grow steadily, but by taking a snapshot of their income when they were twenty-five and comparing it to the income of twenty-five year-olds from three decades earlier you come to the conclusion that "people" are earning less than they used to. I'd like to see some statistics on lifetime real compensation (not just income, but ALL compensation). I'd be willing to bet that it would show that the middle class has done quite well by themselves in the last three decades.
decisions to cut taxes on the wealthy and give very little help to the non-wealthy
This incorrectly characterizes what's been done, because you're failing to distinguish between cutting tax rates versus cutting tax revenue.
Yes, the tax rate was cut on the rich. However, the result of that was that the rich wound up paying more, but as the amount of revenue they contributed, as well as the portion of the total revenue that their contributions accounted for. Since they were accounting for a greater portion, they most certainly did help the non-wealthy.
It seems to me like you're trying to cut off your nose to spite your face. It's not good enough for you that the wealthy paid more, and paid a greater portion. I believe that you actually want to punish them somehow for being rich, even if it means that the whole system has less and operates less efficiently.
I didn't have time to read all ten installments in depth, but I'm having trouble finding the part where it proves that people don't frequently move between income bands. Can you point me to the right section, or provide a quote?
Certainly, the parent post sounds quite plausible. It seems to describe most everyone I know.
I read through all ten parts, and found nothing to refute my post: the author provides no evidence that rich individuals stay rich while poor individuals stay poor. In fact, the only piece that even touches on this subject actually supports my position: in part 7, the author notes that most of the very rich today earn their income through wages, rather than by leveraging inherited wealth.
In general, I am terribly surprised that this article received any upvotes: The author doesn't even bother at the pretense of objectivity, making no attempt to temper (or even hide) his political biases. Furthermore, I found plenty of flaws in his reasoning--here are some highlights:
The author fails to consider the possibility that the U.S. has higher income inequality than Europe because of, rather than in spite of, the lower marginal tax rates on high-income earners in the U.S. He repeatedly mentions the fact that Europe has lower income inequality and that the U.S. has lower top marginal income tax rates, but dismisses the importance of the latter out of hand rather than asking the question.
In part 1, the author conflates wealth disparity with income disparity when discussing Latin America: he mentions very poor people living in squalor outside of walled mansions and cites "grotesque maldistribution of wealth" as an oft-stated reason for societal problems in Latin America. He then attempts to refute this explanation by pointing out that the United States has greater income disparity than many Latin American countries. Wealth distribution != income distribution.
In section 3, the author discusses the impact of immigration on income inequality. He fails to consider the fact that adding large numbers of low-income workers to the economy will reduce the income share of the lower quintiles by skewing average income in those quintiles downwards, regardless of how they impact the labor market for others.
In section 5, the author analyses income growth (and disparity in income growth) as a function of the president's political affiliation. The unspoken assumption seems to be that this serves as a reasonable proxy for how liberal or conservative policies were at the time. A far better choice would have been the party in control of the house: the president can influence tax and fiscal policy greatly, but it is congress that makes policy. Furthermore, presidents tend to be less politically orthodox than representatives: for example, Kennedy set a relatively conservative fiscal and tax policy.
He finishes strong by populating section 10 with a handful of convenient straw men, which he then proceeds to tear down with great sanctimony.
About the only place where I agreed with the author was when he tied income growth to education in section 9, but he applied his same sloppy reasoning and so failed to make a very good argument. If I had disagreed with him on this point, he wouldn't have changed my mind.
This is the reason for that phrase lies, damned lies and statistics. The top 1 percent have been getting an ever-increasing share of gross national income, so their share of gross national taxed income, hence gross tax take, correspondingly went up. Meanwhile, we're staring at a total meltdown on the demand side of the equation -- people who aren't in that top tier have seen their real wages fall consistently since the 1980s. What happens to a consumer economy when you've starved all the consumers?
I'm not saying that the tax code created that upward aggregation - technology, globalization and outsourcing labor are probably the biggest factors in that order. But it seems like a solution addressing the exact opposite of the problem.