If you are interested in learning the basics of Machine Learning I really recommend Andrew Ng's course on Coursera[0]. It starts off very basic and requires almost no prior knowledge other than some linear algebra. It evolves to more advance topics like Neural Networks, Support Vector Machines, Recommender Systems, etc. It is amazing how much you can do after just a few weeks of lessons. It's a very practical course with real world examples and exercises each week. The focus is mostly on using and implementing machine learning algorithms and less so on how and why the math behind them works. (To me this is a negative, but I'm sure some people will appreciate that.)
Not a very well structured article. The animated graphic (which is cool) comes before the lambda parameter is even introduced. That animation should have been put at the end.
It's also not doing a good job at explaining when regularization should be used. The dot cloud in the article is self serving because these points are roughly aligned but they also have a vague cubic form, which explains why the cubic model works better.
The hard part is knowing when you should be using regularization, and that graph doesn't help because it doesn't show further points, therefore not explaining why a certain regression is better than another.
Do you have any sources that expands on how that LASSO optimization problem was graphed?
My thoughts when I looked at it: Where did beta come from? Whats the beta hat supposed to represent? Where'd the contours come from? How come they stopped there? Oh they're supposed to represent the weights? How do they represent the weights? Why is LASSO diamond, the other circular?
I remember seeing that graph a while ago, didn't understand it then, still don't understand it now.
Thanks for your comment. I note several references throughout the article, and they do a better job of explaining than I can in an HN comment. You should check them out! I'll try to explain briefly though.
Fitting a model is an optimization problem: for a given loss function and a training set, find the parameter vector W that minimizes this loss function over the training set. Once that's done, you can estimate labels/values for unseen data using this model.
Regularization is a constrained optimization problem: we still seek to choose the W that minimizes a loss function over a training set, but we have now limited the values of W we can choose from.
Ok, great. What the heck is up with that plot? It's a visualization of the space of all W (we're assuming W is 2-dimensional here), and we're searching it for the optimal W according to the training set. The red contours represent the loss function, \hat{\beta} -- our estimate of W -- represents a minimum for that loss function, and the blue region represents values of W allowed by regularization. We basically want to find the point where the lowest contour lies tangent to the blue region -- that'll be our estimate of W.
Answering your questions directly:
* The blue region is centered at zero because we are penalizing the loss function for higher lengths of W.
* LASSO maps to the diamond-shaped region because it aggressively pushes elements of W to zero (visually, keep drawing red contours and note that the contours are more likely to hit a corner of the diamond).
* L2 maps to the unit circle because it penalizes the loss function using the total length of W; this is represented visually as a circle centered at zero.
It's lambda - basically the amount of regularization (simplification or 'overfit penalty') to impose. Usually chosen by cross-validation - try every lambda between say 0 and 10 in 0.5 increments and choose lambda that gives the model the lowest error cross validation measure...
OP's point (and it's valid) is that the author covers the regularization term but does not explain the task aside from the following throwaway line:
> "The goal is to find the model that minimzes (sp) this loss function."
Unless we're overloading the word "model" -- which is only going to confuse your intended audience -- this statement is incorrect. We're actually searching for the parameterization \alpha of the model that minimizes the loss function.
It actually explains what alpha is. The line above its first occurrence it says: "In the case of polynomials". So alpha are the coefficients of the polynomial.
There both about inference, just slightly different philosophical approaches. Statistics, dating before computers and big data, comes out of math, has a greater emphasis on proofs and closed form solutions, and IMO an opinionated view that what it's modeling is a well-behaved function plus a well-behaved error term.
Machine learning is kind of like statistics for street-fighting. It doesn't care about Bayesian v. frequentist philosophical debates, resorts to cheap tricks like regularization, dropout, using many dumb methods that work better than trying to find the smartest method (ensembles and funny tricks like random forest). If it works in a well-designed test, use it.
There is more than one path to enlightenment. One man's 'data mining' is another's reasoned empiricism, letting the data do the talking instead of leaning on ontological preconceptions of how data is supposed to behave.
Machine learning often works well but you don’t always know why. Stats doesn’t always work and you know precisely why not. (because your data doesn't fit the assumptions of OLS etc.)
I take issue with a number of points in your post, as they don't characterize the differences in the disciplines properly.
> There both about inference
This is actually incorrect -- a large swath of machine learning algorithms (like deep learning and SVMs) are unconcerned with the underlying distribution of your data, and are perfectly happy to generate predictions using a completely uninterpretable model.
> Statistics [...] comes out of math, has a greater emphasis on proofs
There is an entire branch of machine learning, known alternatively as learning theory or complexity theory, devoted to the analysis of algorithmic generalization error. Generally speaking, any popular machine learning algorithm has a proof of its (1) performance and (2) ability to generalize.
> It doesn't care about Bayesian v. frequentist philosophical debates
If this is true, it's only because machine learning has firmly parked itself in the Bayesian camp wherever possible. Naive Bayes, regularization, dimensionality reduction, and graphical models are either motivated by or easily interpreted as Bayesian techniques.
what's your definition of inference, and what do you call the purpose of a machine learning algorithm, and how does that purpose differ from a statistics approach?
perhaps I used the term incorrectly but a dictionary defines inference as "a conclusion reached on the basis of evidence and reasoning."
bottom line... similar objectives, slightly different if often overlapping emphases and bags of tricks.
Inference, in the context of statistical analysis, refers to the task of understanding underlying properties of a distribution. This is the definition used by practitioners.
Machine learning practitioners care more about computational performance or generalizability beyond seen data than they care about properties of a data-generating distribution.
Your "bottom line" summary and repeated reference to algorithms as "bags of tricks" are reductionist statements suggesting you don't understand the nuanced, but important, differences between the fields.
ah, thanks. I look forward to smarter folks than me elucidating the nuanced differences.
I had a distinguished math professor who taught me that mathematics is the application of cheap tricks and bad jokes. He didn't take himself too seriously. When I learned about random forests I couldn't help having a good laugh, it's a cheap trick in the finest sense of the word.
Regularization is not a 'cheap trick'. It is an essential technique for mathematically ill-posed problems, where no unique solution exists. This is extensively studied and well-understood, and is used in many fields outside of machine learning.
Fitting is called training and when you look at it this way, your algorithm gets better and better at some task the more you train it.thus with practice your algorithm learns. It's just semantics.
So how is it different from statistics. It isn't, but usually the focus in ml is on big data and the accuracy of the prediction, while statistics tend to focus more on the explanation of the data.
I believe the reason for the difference is one sprang out of computer science and revived research into AI and therefore is more hip. The other didn't and is still fighting with its image of being dry and boring.
Not at all. Actual AI starts when the exact structure of the model is not known to the author. This is the realm of free form Hidden Markov Models, Support Vector Machines, Restricted Boltzmann Machines and variants of neural networks. Also certain clustering algorithms e.g. kernel projections.
Where the structure of such model depends on training data and is not chosen by the programmer ahead of time.
(Manually structured NNs, RBMs and HMMs do not really count.)
Actually all these models are just variations of well known statistical models (or can be derived as such). For instance support vector machines is the same as logistic regression with a slightly different loss function and regularization. Clustering is also a well know subject of statistics (in machine learning often referred to as unsupervised machine learning). Deep learning is 'just' stacking different models on top of each other hoping to capture more abstract concepts. Very cool but at this point there is not a good mathematical explanation why this works so well.
A lot of stuff is the same between machine learning and statistics with different terminology. With machine learning often more focussing on the practical side rather the theoretical side (or the real probabilities).
It's good to cross pollinate and learn from each other. Such as the machine learning field learning to create better models with Bayesian statistics, and statisticians learning from models like support vector machines.
I also look forward to more mathematicians and statisticians exploring deep learning, and finding more rigorous scientific explanations why they work so well (and this can help us making them even better).
(I come from an Econometrics background, but wrote my master these about machine learning).
You are right it's marketing for a large part. The term Machine Learning somehow implies that the algorithms are more intelligent (or even sentient) then they actually are.
That said, Machine Learning is different from statistics. Statistics are mostly concerned with modeling real world phenomena. Machine Learning is trying to build models that can take a training set and generalize to unseen data without building a specific model for that dataset.
Machine Learning is the latest discipline to become a relabeled and conflated Statistics now that Data Science is old news. They used to be separate disciplines, but for some reason Stats keeps looking for a separate label to glom onto in a similar way that Ontologies used to glom onto every sexy new technology in sight.
In this light, most Machine Learning is just a rebadging of Classification theory that sounds cooler.
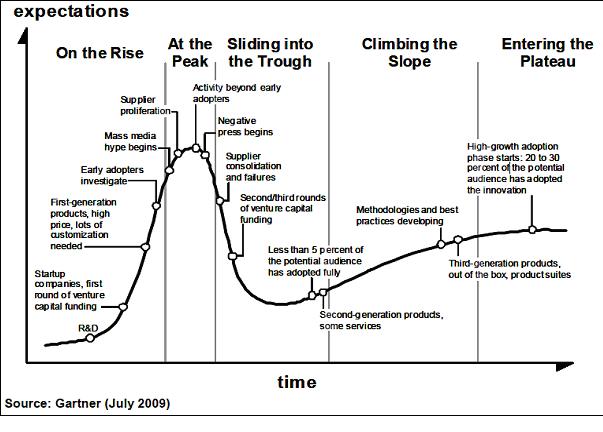
Somewhere in the future, ML will fall off the hype curve [1] and something new will come along for boring old disciplines to rebadge themselves as. The good news is that these disciplines all leave bits of themselves behind and the things they were pretending to be become better and better defined. It's amazing how few job posting for Data Scientist require a PhD a Stats these days, but it was all the rage for a year or two. Now a reasonable Data Scientist can train up on Corsera in a few weeks.
I mean, that is all 'machine learning' and AI anyways. Whoever renames the methods probably does so for additional funding, and this technique is not exclusive to ML research.
An interesting thing about this article, potentially misleading to beginners trying to understand various machine learning and stats techniques, is that despite what the article says, it is not apparent at all that the polynomial model of degree 3 '"sticks" to the data but does not describe the underlying relationship of the data points'.
On the contrary...for this toy example, doesn't it look pretty good! There's really not enough information here to decide whether the model is actually over-fitting or not, and this can easily mislead the beginner into wondering "just why the hell are we taking that awesome model and doing some regularisation thingy to choose a worse model...which is then...better?"
To truly understand, you've got to tackle:
1. What is overfitting?
2. Why/when are too many parameters a problem?
Now...i don't know how intuitive this is for others, but I like to tell people that over-fitting is a fancy word for "projecting too much about the general from the specific".
So why does that matter and what does it have to do with too many parameters?
Well lets say you've got a sample of men and women, and in this case, you're trying to predict underlying rates of breast and testicular cancer (i'm assuming these are primarily gender related for my example), and the "real" relationship is indeed just gender: whether the person is male or female determines the basic underlying risks of these cancers. That's not very many variables for your model. But lets say, in your sample, several of the people with testicular cancer are named "Bob" and several of the people with breast cancer are named "Mary" so you add more variables, binary variables, which indicate whether a person is called "Bob", and whether a person is called "Mary", and suddenly your model prediction amongst your sample for cancer goes through the roof...and yet when you apply it to the population at large, not only did it not predict cancer any better...but suddenly there are all these angry letters from Bobs and Marys who were told they might have cancer. In fact, its doing worse than if you hadn't included those variables at all. What's going on? You overfit.
So you see, in many models, adding in more and more variables can lead you to do better in your sample, but at some point can actually make your model worse. Why does this happen?
Actually, amongst many machine learning and statistical algorithms, there's a pretty intuitive explanation...once its been explained to you.
Lets say that your model only had variables to indicate gender at first, and you come along and you throw in a handful more. You're judging your models performance on its prediction in your sample population. What could many machine learning algorithms do here? Well, for each new variable you introduce, one option is to do absolutely nothing. And if the algorithm chooses to do nothing, what you've actually got is your original gender indicators: you've gained nothing, but you've lost nothing (well, albeit adding more parameter numbers and algorithmic inefficiency/complexity). But most (almost all) methods are not that precise or accurate. So what else could happen? Well, each parameter you add has a small random and statistical chance of increasing your models predictiveness in your sample. We used the example of "Bob" and "Mary", but the people with cancer in your sample could have all sorts of qualities, and as you just through more variables/features at your algorithm, it will eventually hit some that, although having no explanatory power in the population at large, do correlate with statistical quirks of your sample. "Blue eyes", "four toes", "bad breath", "got a paycheck last week" that sort of things. Its a form of data-dredging and its far more widespread professionally than I'd like :P And if you keep throwing variables at it, eventually, many algorithms will choose to naively keep those characteristics that are overly specific to describing your sample, but don't describe the population at large.
And that's why we might want to "regularise". We want there to be a cost of adding variables to the model to make the phenomenon of including statistically spurious variables like this far more unlikely. It is hoped that strong generalisable variables, like male/female, will overcome this cost, while spurious ones added randomly or to game some metric will be less likely to pass that extra hurdle. To use a signal analogy, by implementing a cost for adding more variables, you're filtering out some of the statistical noise to get at the real-loud signal below.
Now, personal anecdote, even though you want to keep models simple (like code, ceteris paribus, and be suspicious of any machine learning/AI technique that uses too many variables...), I don't actually like regularisation often on the whole. In the example, its not actually clear at all that this is a case of over-fitting, and so by following it, you might actually be making your model worse by using it. And in the real world, there's often a number of other techniques that work better (test/train/resampling). But like all techniques, its another arrow in your quiver when the time is right.
The main problem is that regularisation here is described in model fitting context. In actual machine learning context, it is usually called data resynthesis or data hallucination.
The main point to be taken is that input data is modified in some way to hide irrelevant detail. Regularisation does that by injecting specific kind of noise into data.
Don't the fitting coefficients change with varying lambda? Ridge regression varies the fitted coefficients with varying lambda, and lasso can zero out coefficients which don't correlate with the response.
Regularization is the process of modifying the model to limit overfitting, for instance by penalizing more complex models. AIC is a specific application of regularization.
My approach when developing a predictive model has been always to throw the kitchen sink into a stepwise regression and then eliminate parameters based on their F Values. Is there a better way to do variable selection?
The best way to reduce overfitting is with cross-validation. The general way is to set up a hold-out sample (or do n-fold cv if you don't have a lot of data) and then use this cross-validation hold-out sample to do feature, parameter, and model selection. With this technique however there is a risk of overfitting to your hold-out sample, so you want to use your domain expertise to consider what features and models to use, especially if you don't have a lot of data.
Overfitting is somewhat of an overloaded term. People often use it to describe the related process of creating models after you have looked at past results (e.g. models which can correctly "predict" the outcomes of all past presidential elections), and also in a more technical sense of fitting a parabola to 3 points. These are technically related, but I think it would be clearer to have two distinct terms for them.
It is interesting how different fields have different terms for statistics concepts. Statistics really should be taught at the high school level, it is far more useful than for instance calculus. I hadn't heard those terms before. In particle physics we have the "look-elsewhere effect" as a synonym for fishing, and discuss local vs global p-values (which might be similar to researcher degrees of freedom).
Re: researcher degrees of freedom, it's not really about multiple comparisons but about the fact that as an analyst you can make lots and lots of choices about how to construct your model that, individually, might well be defensible, but that ultimately end up making your model very data-dependent. You see some outliers and you remove them, you see some nonlinearities so you analyze the ranks instead of the raw data, you don't find an overall effect but you do find it in some important subgroups which then becomes the new headline, and so on and so on. At no point was anything you did unreasonable, but the end result is still something that won't generalize. A wonderful article about the phenomenon: http://www.stat.columbia.edu/~gelman/research/unpublished/p_...
> My approach when developing a predictive model has been always to throw the kitchen sink into a stepwise regression and then eliminate parameters based on their F Values. Is there a better way to do variable selection?
It depends on whether you care more about good predictions on data drawn from the same source or more about unbiased parameter estimates. For example, if you unwittingly add variables into your model that represent an intermediate outcome, you'll get selection bias and your parameter estimates will be off.
You should test your model on a part of a dataset that it has not been trained upon. You divide your dataset into `train´ and ´test´. You develop your model on the ´train´ part and check its predictive power on the ´test´ part and compare it to the predictive power on the ´train´ part. IF, the predictive power on the ´train´ part is very good but it performs poorly on the ´test´ part - it is likely that your model is overfitting viz. it has little generalization power and can only do good on ´train´ part of the data.
In order to be more sure, you can repeat this process by dividing your dataset into different ´train´ and ´test´ sets. This is called cross validation.
Parameters usually means number of features or independent variables. Hyperparameter values are the algorithm constants.
How you eliminate depends on your data and your algorithm choice.
You know when you are overfitting when you are doing really well on training data but poorly on validation data. However, you shouldn't overfit if you choose L1/L2 regularization hyperparameter based on best results in 5-fold nested x-validadation.
You generally still do worse on training set than on testing set with nested x-validation, but it doesn't matter because at the end once you choose the hyperparameters you train on the whole training set.
Sorry my background is in engineering not stats so I probably confused my terms a little. I think I mixed up 'variable' with 'parameter'.
As an example of what I meant, at the plant where I work we are often concerned about yield (the ratio of input mass to output mass). We measure a number of different "terms" during our process which we have control of to varying degrees (As an engineer I call these terms parameters I guess a statistician calls them 'independent variables').
So the term I'm trying to model is yield and my input variables are the various 'terms'.
I will read up on cross validation now (hadn't heard of it before). My work uses SAS - a quick google search suggest SAS supports this test.
Yep. It can be hyperparameters ("knobs to tweak" as eanzenberg puts it) but regularization is also often used in a regression context where regularization either pulls parameter estimates for features towards 0 or just kicks out features altogether.
[0] https://www.coursera.org/learn/machine-learning