I'm surprised the article didn't mention anything about the nuances of actual logging in a distributed architecture. In particular, when a request starts to span multiple containers or microservices, you need a way to correlate all log data to a given request. You typically do this by propagating a trace ID through your logging system, and a vector clock-type thing for causal ordering. If you can't tell which log statements belong to which request and the order in which they occur, debugging is quite hard :-).
There are a number of distributed tracing tools now. I've heard good things about Zipkin[0], but not used it myself.
The key is not just to have a single request ID, but also to provide hop IDs. Relying on clocks, even vector clocks, isn't ideal in a share-nothing architecture.
Zipkin is great. It's pretty simple to set up, and you can instrument pretty much anything to send data to it. We made it a part of our internal httpclient and Kafka client so most teams get the tracing for free.
You can even visualize the internals of Cassandra with zipkin. :)
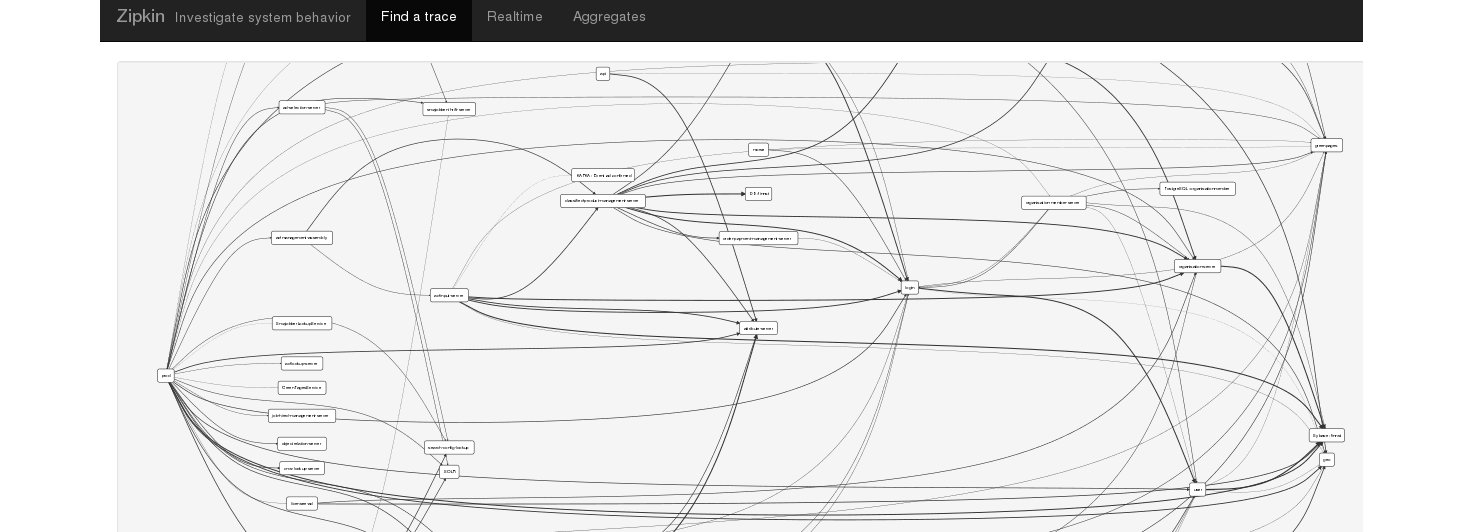
There's support for a Spark-job that generates a visual map of all your services' dependencies[0] where the strength of their relationship is represented by the thickness of the lines.
I've just started down a path for us and been pretty happy with Loggly so far.
Just by adding a UUID to the requests as they're initially received I'm able to follow the chain of events across 5 different services, a message queue, and reconcile with any code exception reports from Bugsnag.
We don't have a lot of unique clients, but we do have a lot of requests.
Loggly can be set to parse logs (or have the data sent directly to it) and then tag messages with keys/values that can let you watch your request through every server.
Yeah, Loggly is very solid. I've set up logging infrastructure for 2 companies using it now. Their structured logging parsing, searching, and alerting is fantastic.
Now that I understand the parent comment, I don't think this quite solves the problem he's asking unless all of your services are perfectly synchronized. No?
For us, messaging between services go through queues and a client request might start in a particular service and wind it's way through a few others to finish the work. You wouldn't have the same client requesting things from two different services simultaneously, though in fairly short order they come through. Our use case might be just simple enough that this wouldn't work for a lot of people.
Also, if I'm looking at access logs I'm not going to have that ID unless I start putting it in request headers. Right now the application logs and other monitoring tools pick it up though.
Edit: Didn't see mention of the clock on my first post, but it still stands for us that we're not in the millisecond timings between requests going in and out of services so we haven't had a problem with the timestamps from the systems they're on. Requests generally take a few seconds to process (handle a file upload of decent size, ETL some data, pump out some output document, etc) so each step through a service buys enough time before moving on to the next thing that we're not getting out of order log statements across each service.
Any tips for a beginner on optimizing usage of the dashboard? Not using it for much right now, and I feel like the interface is going to take awhile to optimize/learn.
My web stack checks for a specific header at each potential level of entry, and in the absence of a value, generates one. Then each layer's logger will log it back out. It's pretty straightforward for web requests - just use the plumbing that's already there, headers.
While the article does not touch on this explicitly, Docker's Log Driver for Fluentd supports tags, which can be used to pass on container name/ID and other metadata to wherever logs are sent. Since Docker Machine itself allows these metadata to be passed on via API ({{.Name}}, etc.) one can create a fairly robust system to track log lineage.
How would passing on the container ID help in mapping multiple log messages to the same request? If a request is going through multiple containers, you'll get multiple container IDs.
To solve this problem, you need a unique trace ID and vector clock, and this actually needs to propagated through your logging system, not through container tags.
Ah, I completely misunderstood. Yes, you are right: Threading data together across multiple containers belonging to a single logical request is hard (and AFAIK, none of the container orchestration tools deal with it well).
How is the unique trace ID implemented? Vector clocks would be in use by your distributed data store for conflict resolution such as Riak does. Could you elaborate on how you've implemented such a system?
It's not about conflict resolution, it's about ordering.
Imagine you have 3 services. A calls B calls C. A request goes into A. The request fails. Since there are 3 services involved, you want to be able to see the log statements of all 3 services, in order. To do this, you need a UUID that is passed from A to B to C and a vector clock that is incremented from A to B to C so you get perfect ordering. Passing the data around is not super hard (you can use HTTP headers, for example). The tricky bit is having a library that does the right thing in A and B and C. And if A is written in Java and B is written in NodeJS, that library better work on both!
Really, it's when you're doing microservices, and each service is deployed to a different container. Typically your business logic is now spread across multiple containers. For example, you might have a recommendation service that looks up location in the geo service. If the geo service returns bad data, then the exception is thrown in the recommendation service. But to debug this properly, you really want to see the logging in both the geo service and the recommendation service, in order. As your topologies get deeper, the problem gets exponentially harder.
I wasn't saying you needed microservices or containers to do distributed logging. My point is that if you're building a distributed system, you need distributed logging (tracing) semantics. The actual logging mechanism (syslog, fluentd, etc) can be used -- as long as you propagate your UUID, etc.
The first paragraph closes with a series a incorrect assertions contrasting containers with VMs, and "distributed logging architecture in the container era" is apparently nearly identical to the distributed logging architecture of the VM era in reality, but according to the article is a completely different thing and mindset altogether... again while looking basically identical.
Mine live for milliseconds, but I'm a weird case where that's intentional as a security construct.
But that doesn't really have anything to do with the logging architecture. How long the thing lives doesn't matter when you're using aggregation, bypassing the local filesystem, and inspecting through a central portal.
People have been doing this in VM environments for a lot longer than they've been using containers. Whole companies and services were born to facilitate this, and some have even died already, in the time before containers hit full stride in the hype cycle.
Yes, I was left scratching my head as to why containers play any significant role in the issue of distributed logging. If your choice of container runtime/vm/servers are creating an issue with logging then there's most likely an issue with the system architecture rather than actual logging.
We've been building distributed systems (with containers and other approaches) for years and this is the first time I've heard of logging being a problem.
This is going to sound dumb, but I started dumping all my logs into mysql so that I wouldn't also need to run an elastic search cluster.
I then query by the error level, latency, status code to find items of interest.
And everything is stored by some sort of request ID so that I can correlate multi-entry logs.
It's not pretty -- there's no real-time alerts, but I'm not paying dollars per gb to AWS and I have no clue what google will end up charging... and I'm already running mysql. So there is that...
Fluentd is decent (though I rather wished Heka had taken off; it's much more flexible and in theory leaner and faster since it's Go), but I'm still looking for a good solution to aggregate, inspect and search logs.
In particular, the ability to live-stream ("tail") logs seems to be a feature generally missing from logging aggregators. There was one (Loggly?) which provided a CLI tool for tailing, but it wasn't very impressive. (All the SaaS apps I have looked at do quite poorly when it comes to rendering live logs in a browser, too.)
Also, as other sibling comments mention, there are tools, both SaaS and open source, that you can use as a destination of the logs Fluentd tails/listens/collects.
>though I rather wished Heka had taken off; it's much more flexible and in theory leaner and faster since it's Go
Heka was a great project, and a drop-in binary (as opposed to requiring a VM like Ruby) approach was interesting if not compelling in certain situations. That said, I never saw any benchmark that showed Heka was materially faster than Fluentd (or Logstash, for that matter). A lot of speed in this type of complex software comes from data structures/algorithms, an appropriate use of low-level language bindings, etc.
While language plays a role in the speed of software, it's hardly the only factor. As you said, it's only in theory, not in practice =)
I meant tailing the aggregated logs themselves. I have looked at the CLI tools that exist for some of those SaaS services, and I have not found anything half decent.
For example, you will definitely want to filter on labels (including regexps) while tailing, and such filtrering should support adjustable context (both # of lines and time interval) and should support an optional time range to scroll back into history ("tail from 2pm"). And of course, grepping of historical entries.
Another thing I am not impressed with is pricing. Loggly seems the most reasonable in terms of price per volume, except it limits the number of "team members" to a ridiculous degree (5 users or something like that).
I set up Graylog once and wasn't impressed with it. Its reliance on Elasticsearch means it is quite static when it comes to the schema/input format. You can't change the settings; there is no reindexing support (or at least this was the case when I tried it, a year ago or so). Also, don't think it has any CLI tools?
Well, it's a tall order, but I think your best bet is to build something with elastic stuff: beats, logstash, elasticsearch, kibana. We store logs for long term in Ceph (we contributed a RADOS plugin so logstash can output directly into Ceph).
So, new stuff goes to elastic, gets indexed, you can look at it via Kibana, or build custom dashboards, even directly from the logstash firehose.
As logs get older, you can delete whole daily indexes from ES, and if you want to investigate/datamine/aggregate something, you can still grep the archived logs.
The bottleneck will be probably Kibana (or the admin/operator looking at the end result), as all the other components can be scaled (beats are already per-node, logstash is stateless, so just run more of them behind a round-robin DNS name and beats will pick one up - or of course you can use HAproxy to load-balance, and the elasticsearch cluster can be rather large too).
It's self-hosted, not a service, but it is rock solid, and it can easily sustain tens of thousands of messages being sent to it per second. Docker can send Graylog logging messages natively.
I started using this recently. Initial page loads are kinda slow, searches are fast and so is clicking links after the initial page load (seems to be a SPA). Did you encounter this at all? If so, know any fixes?
How much RAM/heap do you have assigned to the Graylog web frontend node? All on the same instance/physical server? Keep in mind, Graylog is using Elasticsearch under the hood extensively. If you're not allocating enough ram, you're gonna have a bad time.
If you'd like, I can send an initial email to you (from your HN profile) and you can bounce questions off me if you'd like.
16GB for the OS, with only 10GB used most of the time currently. I'm also using pretty much the default graylog configuration, not sure what needs tweaking since it's really just the initial pageload being slow. Anything that's done after that without reloading the page is nice and speedy.
Are the screenshots from the old or new UI? Looks a bit dated on first glance (sorry).
However, the pricing looks very silly. 10GB/day is toy volumes, and only 30 days' retention, and this for $400/mo? That's not going to fly (sorry again).
Re: pricing. A much bigger topic than there's room for here on HN, but in short - for a service that can ingest 1TB/day+ of your logs and gives you search times measured in milliseconds, you'll actually find our pricing is not only in line, but below a lot of other commercial providers (Splunk, Sumo Logic, etc.) And when you compare TCO with open source solutions (ELK, etc.) that require a significant amount of effort to scale, it's similarly competitive.
I think all the current logging providers are hugely overpriced. I understand why people run ELK or Graylog themselves.
I suspect you're going to feel some competition from Google StackDriver/BigQuery. You can load 300GB/mo (your biggest plan) into BigQuery for about $156/mo including storage.
As someone who is basing our stack on Kubernetes, "effort to scale" is pretty damn small these days!
I recently just plugged python logger from https://github.com/GoogleCloudPlatform/gcloud-python#google-... into my python codebase. Configuration took 15 minutes, I have nice dashboard showing recent logs, I can log either strings or jsons. I can analyze data later using BigQuery. It works from docker containers.
I was contemplating trying out logstash or fluentd, but I don't see any major advantage over current simple solution. Can anyone more knowledgable than me help with explaining what I would get from logstash/fluentd?
Does any of your Python processes open a subprocess that then spawns another Python process as a child (and both gets logged)? If so, have you found any good way to associate the the parent and child logging messages?
If you just write to stdout everything makes sense in the file top to bottom, but if you're logging json objects into a database I had problems; if your parent process echos stdout from the child you lose a lot of context about the child, you can also double-log child process messages (because the parent is also echoing them), and you can't easily associate the parent/child objects. I came up with a hacky solution, but I wasn't logging these events to a centralized server at the time.
(I haven't used gcloud's dashboard, so I might be making wrong assumptions)
To respond your question: it sounds like you have something that works fine for logging messages. Personally, I split it into categories 1) logs (serial events that needed context for any usefulness) and 2) events (metrics or exceptions). I wrote 1) to traditional log files and wrote 2) to an ElasticSearch or statsd database to log exceptions to. Ideally, I wanted to use the same mechanism for both and peel off relevant data into separate databases.
A metrics database like Elasticsearch will let you query things like, "What modules give the most errors?" "Has this function been called more often this week than last?" "Is this process taking longer when using the newly released version compared to the old one?" etc.
Inbuilt docker + fluentd driver + plain ES falls flat on its face under scale. Not to mention docker daemon keeps dying :(.
Whats working for us now is local docker json logs -> heka -> kafka -> graylog -> ES. We even dockerized graylog to scale the processing up and down on demand.
Heka proved to be the weak link in our logging stack. We get far better performance from fluentd. We use a multi-tiered fluentd architecture. One tier accepts logs from Docker and (optionally) sends a container's log stream to a developer-managed custom fluentd parser. From here, logs are sent to a fluentd "sink" for storage in Elasticsearch. Using multiple tiers helps prevent overload and acts as a buffer if ES slows down temporarily.
> Heka proved to be the weak link in our logging stack. We get far better performance from fluentd.
I'd be curious to know some more details on this. I guess Go channels do copying rather than sharing, but I'd still expect Heka to perform better.
Personally I've found Heka to be more robust - I've had to fix bugs in plugins for the former two and generally I haven't found them to be architecturally sound.
For example with logstash I've had bugs in plugins which would crash the entire daemon -- that's just inexcusable for a core infrastructure service.
The multi-tiered thing sounds very strange, why not just hold an on-disk buffer?
Believe me, I wanted Heka to work. We're a big Go shop and I understood Heka better than any of the competing log shippers. We got very deep into Heka and ultimately, it just couldn't do the job. It performed very poorly when there was any sort of a bottleneck into Elasticsearch. It would enter an unrecoverable state when it got choked up We spent a lot of time on the Heka IRC channel talking to the devs. These were known issues. Some of the Heka team are/were working on a replacement written in C. It sounded promising but the ES output plugin did not exist yet so we couldn't use it.
The need for a performant and powerful log shipper is still there. I hope to see some new options come around soon that can achieve 1MM+ lines/sec from a single daemon without requiring multiple tiers, receivers, etc.
For the last year we have been working in a lightweight log shipper product called Fluent Bit[0]. Originally made for Embedded Linux now is taking it place in common environments.
It's pretty similar to Fluentd in architecture, some features are:
- Event-Driven (async network I/O).
- Input / Output plugins.
- Data routing based on Tags.
- Optional SSL/TLS for networking operations when required.
Next major version 0.9 will come with buffering support (memory/file system). Ah, it's fully made in C.
I see that your input/output plugins are written in C[0]. I'm guessing this is because of the constraints of the embedded environment, but it really doesn't seem like it would be worth it in a normal one. The LUA sandbox model (e.g. Heka) just seems highly preferable.
My main problem with Logstash/Fluentd is precisely the fragility and non-robustness of the plugin system.
The whole project is in C, there is a planed Lua support for the future versions that can help to filter/modify records, more news about it in the incoming weeks ;)
The decision about "why C" is: flexibility, performance and adaptability (note that it was originally designed for Embedded Linux targets, but now going everywhere). In order to make things easier for output plugins, every time a set of records needs to be flushed through some output plugin, a co-routine is created so any plugin can yield/resume at any time. For example out_http, out_es and out_forward relies on network I/O, having an event loop and a coroutine associated allows to simplify the plugin development and state management: connect, write, read, etc. This model is the foundation and allow the next step to integrate scripting more smoothly. For environments without co-routines support (old compilers), a POSIX thread model exists.
What are the specific "fragility"/concerns you see in Fluentd plugin model?
Same for us fluentd was very resource hungry, heka brought down utilization significantly.
Regarding the buffering we just added kafka in between
for graylog/ES scaling/maintenance.
It'd be useful (not to mention entirely feasible) to be able to handle 5M/sec bursts on a single system and aggregate sustained 50M/s+ (10Gbps network).
The system should be able to establish total order (serialization) locally and causal order over the network.
I did some tests and found out hardware limits are somewhere between 20-50M messages per second (serialized) on current consumer grade X86. Practical implementation would of course be slower.
Of course you need to go binary logging at that point, adhere to cache line boundaries, etc. mechanical sympathy. Maybe even do usermode networking at the aggregator server.
Binary logging is a must, because even something like string formatting is simply way too slow, by an order of magnitude.
In my quick tests I found the string processing hit to be surprisingly high, 10-50x. C "sprintf" and C++ stringstream are atrociously slow. (Surprisingly, considering sprintf has a pretty complicated "bytecode" format specifier parsing loop, it was still significantly faster than stringstream implementation.)
Timestamps are another huge performance issue. Typical system calls for high precision (a few microseconds or better) timestamp take several microseconds each - using one of those will alone drop performance to 100-500k range. It's of course much faster to use RDTSC, but then you have the issue that different CPU sockets have different offsets (sometimes large) and possibly also some frequency difference between them. Also older CPUs don't have invariant TSC, so their speed changes when CPU frequency changes.
(Some word of warning about Windows QueryPerformanceCounter: When you test it on your development laptop, it appears fast, because it's using RDTSC behind the scenes. But when it runs on a NUMA server, it often changes behavior and becomes 20-100x slower, because Windows starts to use HPET instead. RDTSC takes maybe ~10 ns to execute and it's not a shared resource. HPET takes 1-2 microseconds to read and is a shared system resource, concurrent access from multiple cores will make it slower.)
Timestamps are even worse. They're slow to get and have a multitude of other problems, like timezones, system clock adjustments (manual or NTP), rate drift, offset errors, etc.
Some solve it by caching a low res timestamp, but that means losing ability to get side channel information about precisely how long time passed between two events. High resolution (micro/nanosecond range) timestamps give so much more information than just time.
We haven't dealt with those yet. But in general we are always pushing everyone to log judicially, use metrics wherever possible (numbers are still easier to manage than strings), use sentry for exceptions logging and introducing zipkin for tracing.
Sure I've had my share of heisenbug. Still remember one not long ago where the dev enabled debug logs in all our applications at once over the week end. It turns out that a week end of log is 1 TB :D
Back to the topic. I suppose that saying "5M/s" to refer to 5000/ms during a single millisecond is misleading.
There are many implicit "buffers" (raw CPU power, intermediate hard drives, TCP queues, syslog/fluentd processing) that may smooth that kind of peak very aggressively long before it reaches graylog.
Interesting talk by the way. I'm doing similar things, at a smaller scale though.
The Docker logging model of line-by-line stdout/stderr doesn't seem very useful beyond debugging in the local console. I prefer configuring the application logger to ship logs directly to a proper log system when possible.
E.g. Logback is perfectly happy shipping structured logs directly to Kafka or Elasticsearch, with no need to re-parse the formatted log output.
> The Docker logging model of line-by-line stdout/stderr doesn't seem very useful beyond debugging in the local console.
It's a well-understood pattern that Heroku made more visible under "The 12 Factor App".
stdout/stderr require no configuration in any language that I'm aware of. Why should the app care about how to wire up logging? That's a platform concern.
On Cloud Foundry you get Loggregator, which frankly needs improvement, but for the most part you don't care about how to wire up logging. You print to stdout or stderr and the platform wicks that away to a firehose service for you. You can hook up kafka to spout, or elasticsearch, or anything else you like.
Disclosure: I work at Pivotal, we donate the majority of engineering to Cloud Foundry.
stdout/stderr is actually a perfectly lovely default contract between application and operational environment. It's available to all programs, it's sync by default, and the semantics are intuitive.
They say that without aggregation scale-out is impossible. That's simply not true. Using things like anycast and ECMP it's super easy as log destinations are usually stateless.
Also, never had network contention because I logged too much unless something was really broken - and then only at that node.
I'll continue sending events to my anycast address without any aggregation thank you very much.
A "probably" there would be nice. I don't want to have to defend myself, but I'm pretty confident about the scale I've worked on.
I guess it boils down to what you call aggregation.
Is having multiple stateless receivers behind anycast/ECMP aggregation writing to a distributed database aggregation? I'd argue not, but maybe this is where the difference in opinion lies.
They are all much of a muchness....fwiw distros that ship with rsyslogd as the syslog daemon are in a good spot, since rsyslog can do sufficient routing and spooling to account for network interruption. One less thing to install. And it supports the latest structured syslog RFC.
That said, I use nxlog basically everywhere because I run a heterogeneous environment and it works well on all OS's I use (and is fast and light on resources)
> But unlike syslogd, Fluentd was built from the ground up to unify log sources from microservices, so they can be used efficiently for production and analytics.
syslogd(8) -r This option will enable the facility to receive message from the network using an internet domain socket with the syslog service (see services(5)).